“How is your work going?” a UNC professor casually inquired. We floated in Bogue Sound during weekly Wednesday night swimming, resting before the next lap.

“It’s…okay,” I hesitated, then explained. “I’m working on methods right now.”
“Ahhh yes,” he replied like he immediately understood. “Not very exciting, you’re not getting any data or results.” His empathetic response put me at ease after a discouraging day in the lab. Everyone who does research has to troubleshoot their methods- I was not alone.
Methods are techniques used to obtain data. For example, social scientists may design surveys to gather opinions on an issue. A food scientist may operate an atomic absorption spectrometer to measure the calcium content in broccoli. A watershed engineer may use a ping pong ball and a stopwatch to measure water velocity.
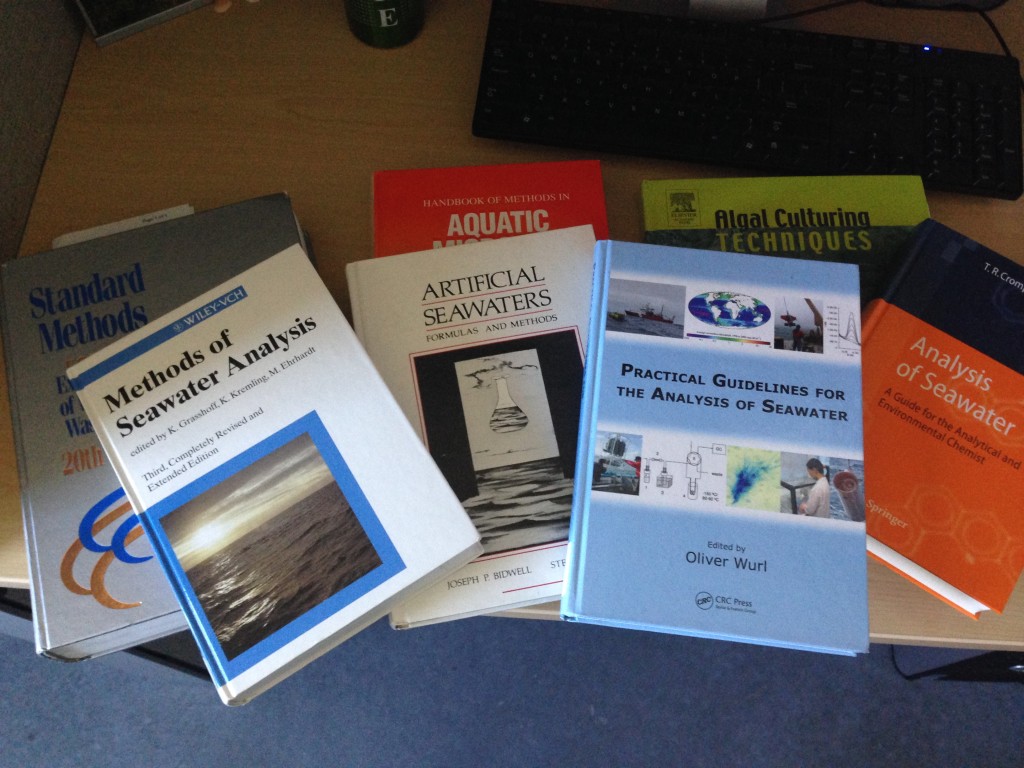
There may be multiple accepted methods to obtain the data you need, and you may need to choose, test, and modify the most appropriate one. My own starting point was reading the “Methods” section of published articles as well as methods books.

I wanted to measure compounds excreted by algae cells into the surrounding water. My research is on water reuse for growing microalgae (single-celled algae, not seaweed). These algae are grown for products like fuels, nutraceuticals, and more, and they grow in large volumes of water. Reusing this water to grow more algae is necessary for economical and environmental sustainability. However, it’s unsure how well algae can grow in water that’s already been used. I want to measure how much “stuff” is leftover in the water after algae grew in it, to see if higher concentrations of stuff lead to reduced algae growth in this water.
I researched and tested several different methods to measure compounds that algae could be releasing into the water. None were successful because the stuff I wanted to measure was at very low concentrations- it was like trying to use a meter stick to measure a grain of sand. I contacted another researcher who thoughtfully recommended another method to measure carbohydrates in seawater. Carbohydrates, or sugars, are the most abundant type of compound that algae excrete.
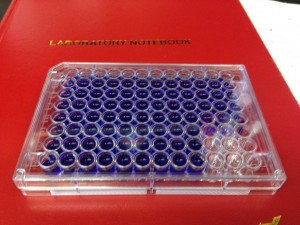
The TPTZ method, first published in 1997, measures dissolved carbohydrates in seawater by a series of chemical reactions. The water becomes a certain shade of blue based on the amount of carbohydrates in your sample, and you can measure the color with an instrument called a spectrophotometer.
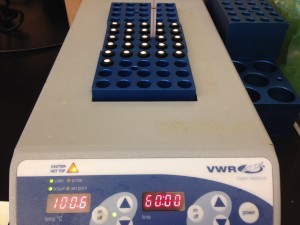
I wrote up my own version of the method based on multiple sources, then ordered supplies and made the necessary chemical solutions. I washed tiny glass vials, rinsed them, and put them in an oven at 500 ºC to burn anything off that could contaminate my samples. I prepared standard samples with known concentrations of carbohydrates, and grew algae cultures to test the method on my own samples.


Everything went fairly smoothly in the several hours that the method took to complete. But one by one, all of my standard samples with different carbohydrate concentrations appeared the same dark blue color. I measured the same value for different standards with the spectrophotometer, even though they should’ve all had different values. No no no, I thought. This was supposed to work.
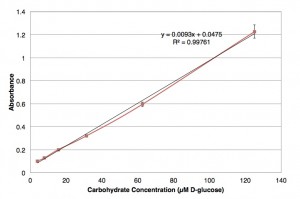
My frustrated self wanted to stop testing the method, but instead I ran through every possible issue that could have led to these results. I decided that the standard carbohydrate concentrations I was testing may have just been too high, and the method probably maxed out. The next day I made standard solutions a thousand times less concentrated than the day before. And I made a beautiful, linear standard curve.

Alas, after testing many sample preparation techniques with my own samples, it appeared that my samples still had miniscule concentrations too low to be picked up by this method. Deflated for the umpteenth time, I thought of reasons why the concentrations may be too low. Perhaps my algae just are not exuding that many carbohydrates because there aren’t enough cells. I could add more nutrients to their growth medium so that there are more cells in my cultures secreting carbohydrates, and test these samples.
Everyone develops their method strategies, using resources and advice to move forward. While working on methods, you may not be getting data and results, but you are building the tools used to answer your research questions in the future. And I know I’m not alone, because PhD comics has a comic for this.

