An important goal of the MISHAP program is to place the foraging behavior of Antarctic humpbacks into the context of their prey distribution and density, and in relation to other krill predators.
So, while Ari and the tagging team are out-and-about trying to slap a tag onto our big rubbery humpback friends, the visual observing team is hard at work counting the multitude of predators that co-exist within the protected bays and channels of the Gerlache Strait.
This is no easy task.
First off, it’s the Antarctic, and verging on winter. Cold, windy and only light for about 6 hrs per day. For the most part, this means that our brave observers must stand outside in -18 degrees celsius wind-chill in the failing light and try to count distant whales from an observation platform 80 feet off the water. The observing team counts predators along track lines everywhere we go down here, coincident with ongoing active acoustic prey surveys and oceanographic sampling. So, when the weather is good enough to confidently survey our study area, the observers are hard at work.
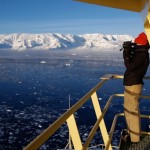
- Reny Tyson calls in sightings of humpback whales from the ice tower catwalk.
Secondly, the densities of krill predators here are so high, keeping up with sightings and taking special care not to double count critters become gargantuan tasks.
To help address these problems, we’ve split up our observation protocols between two stations that execute very different types of visual surveys. For our primary targets – the whales – we observe from the ice tower and sample the region using a technique called Distance Sampling. This technique requires observers to call a distance and bearing to every group of whales sighted – that’s a lot of work, especially for the data recorder when the sightings are coming in fast and furious. These data are then used in a statistical model that tells us what proportion of whales we count along track lines in our study area. For the remaining krill predators – the seabirds (including penguins) and the seals and fur seals – we use a strip sampling method from the bridge (we also count whales in the strip, for comparison to distance counts). So, in this case we count every krill predator that comes within 300m of the ship while we travel along our track lines. This strip survey method eases the load for the distance sampling team, and provides observers with some respite from the cold as we can observe from inside the bridge.
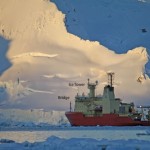
- Colin’s picture of the the NB Palmer survey platform – Ice tower and bridge observing stations.
How’s it going you ask?
Amazingly.
Here are some basic statistics for just 6 hours within a two day period.
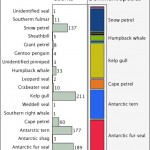
During May 19 and 20, 2010, the MISHAP visual observer team detected 188 groups of humpback whales in Wilhelmina Bay, which means they counted about 337 individual whales in two short days. And that was just from the ice tower! During the same period the strip survey generated 856 sightings of 17 different species of krill predators – from right whales (yup they eat krill down here too) to gentoo penguins. These 857 sightings were comprised of about 1800 individual krill predators. This figure below details these results. Very cool stuff.
- Accumulated sightings from the strip survey during May 19-20, 2010. Counts and dominant species counted.
If that seems like a lot, you are right. When I worked on surveys in the central Pacific, we were lucky to accumulate 90 sightings of whales in a 3-week cruise. We doubled that in 6 hours!
In conclusion, my blog is a big shout-out to the other members of the visual observing team: Meagan Dunphy-Daly, Lindsey Peavey, Andy Read, Reny Tyson and Danielle Waples. These folks are epic and legendary observers. Thanks guys!
Dave


