We woke up today in Wilhelmina Bay with winds gusting up to 50 knots and snow pouring down on us.
Such conditions are not favorable for launching the small zodiacs and/or for visually surveying for predators atop the 80-foot high ice tower (don’t worry mom, there are railings!). Thus, with little to do outside the ship (in fear of being blown away) the Chief Scientist declared today a “snow day.” Many of us took this chance to process and analyze the data we have been collecting. 
One of the data sets we worked on today came from the Dtags we have been deploying on the whales. Many of you are probably wondering, “What are these so called tags?” and, “How are they helping us learn about humpback whale dive behavior?” Well let me try to explain…
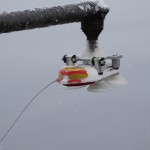
The tags we are using are called Digital Acoustic Recording Tags (otherwise known as DTags). These tags attach to the whale non- invasively by means of four suction cups and they record the whale’s pitch, roll, heading, and depth, as well as the temperature of the water. In addition, these tags have a hydrophone (i.e. underwater microphone), which records any and all sounds heard and/or made by the tagged whale.

The tags have a VHF radio antenna that allows us to keep track of the tag (and the tagged whale). Whenever the tag is above the water (for instance, when the whale surfaces to breathe) we can hear the tag’s signal (beep… sccrrssshp…beep…schieeekss…beep…sechiees)and pinpoint the general location of the tag (more detail to come in Andrew Westgate’s upcoming ‘ups and downs of radio tracking’ blog).

After a pre-programmed time period (typically 24 or 48 hours) the suction cups release from the animal and the zodiacs race to retrieve it. Once the tag is happily back in our hands, the download process begins. After a few patient hours of downloading the massive amounts of data collected by the tag, we are finally able to visualize the tagged whale’s behavior. One way we do this is with the program TrackPlot, a 4-dimensional visualization software program developed by Colin Ware (one of our super-smart data visual-ization team members).
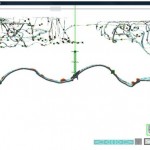
TrackPlot uses the information collected by the tag to recreate the underwater behavior of the tagged whale in space and time. For example, the plot above is a recreation of our first tagged whale, Malcom’s, underwater dive behavior. You can see that Malcom moves in a scallop fashion from left to right, presumably lunging for its favorite food (yummy, delicious krill).
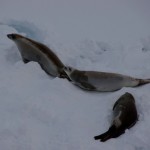
Amidst all of the “snow day” data processing, we were graced with a few rays of sunshine and periods of calm winds. During these periods, the visual survey team (Dave Johnston, Andy Read, Danielle Waples, Lindsey Peavey, Meagan Dunphy-Daly, and myself) conducted a visual survey deep into the head of Wilhelmina Bay – where we had nearly 100% ice-coverage. While we didn’t observe any humpback whales, we did see around a hundred crabeater seals and several species of birds, once again demonstrating how the gradients in ice have a huge impact on the structure of this ecosystem (see Andy’s blog from yesterday for more details).
Tomorrow we are all hoping for calmer seas and clearer skies. Wish us luck! On a personal note, I must wish a very happy birthday to Jason. I only wish I could be there to celebrate with you!
-Reny
Beep… sccrrssshp…beep…schieeekss…beep…sechiees
Thank you for you explanation of the tagging process and of the data you collect from it, Reny. Love your sound-effects transcription!